Try with: g->SetMarkerStyle(4); g->Draw("AP");
Thank you @Wile_E_Coyote. I tried it, but I get the same plot…anyway, don’t worry…I don’t think it’s a big problem…surely it’s due because of the error is small.
Hi @Wile_E_Coyote I showed the fit to my supervisor, but he replied me that I’ve to do it event by event (that’s because his collegues sent me the fit_line function).
I wrote him asking him what he means… I wrote him that I fitted
and he replied
You have to extrapolate the parameters by a linear fit for 2-3 measures (x,z) event by event.
Moreover, my supervisor’s colleague wrote
You have (event by event) do define the position where the particle enter in the lead glass so that you can correlate the energy to te position. Moreover, I suggest to keep as zh position the one in the experimental setup layout and not the one in the ROOT file.
So, given that the z values are z33= 1873.93, z35=1995.43 e z37=2125.43, I 've to plots the points
Ai=(1873.93, x33[0])
Bi=(1995.43, x35[0])
Ci=(2125.43, x37[0])
then I’ve to fit them by the fit_line.c ti get a,b for EACH event (i.e. each triade Ai,Bi,Ci).
This should be’ Linear regression - Wikipedia the typology of the fit done by the fit_line.c macro
I tried in this way:
- Before of
TBAlign::Loop()I wrote
a.
#include "fit_line.C"
b.
float a,b,ae,be,chi2,q;
   float x[3];					  // x coordinates of hits
   float z[3]; 					 // z coordinates of hits
   float ex[3]; // errors of x coordinates of hits
- Inside
TBAlign::Loop()I wrote
fit_line(z,x,3,ex,a,b,ae,be,chi2,q);
        x[0]=x33[0];
        x[1]=x35[0];
        x[2]=x37[0];

		TCanvas *c3 = new TCanvas("c3", "track", 200, 10, 700, 500);
  		TGraphErrors *g = new TGraphErrors(3, z, x, 0, ex); // hits x versus z
  		g->SetTitle("si-500596, #mu^{+}_{22 GeV}- x-z coordinates Silicon Trackers 33-35-37;z (cm);x (cm)");
  		g->SetMarkerStyle(4);
		g->SetMarkerColor(4);
  		g->SetMarkerStyle(21);
  		const char *f_name = "fit_line"; // standard ROOT linear function
  		g->Fit(f_name, ""); // e.g. "" or "Q" or "V"
 		g->Draw("AP");
 		gPad->Modified();
		gPad->Update(); // make sure it's really (re)drawn
   		c3->Update();
   		TLegend* leg = new TLegend(0.65, 0.7, .75, .75);
   		leg->SetHeader("Legend");
  		leg->SetNColumns(1);
   		leg->AddEntry(g, "Data", "l");
 		leg->AddEntry(f_name, "Fit", "l");  //TO USE FOR 2 GAUSSIAN FIT
   		leg->Draw();
   		c3->Update();
   		gPad->Modified();
		gPad->Update();
 		TPaveStats *stat= (TPaveStats*)g->GetListOfFunctions()->FindObject("stats");
		stat->SetTextColor(kBlue);
		stat->SetX1NDC(0.80); stat->SetX2NDC(0.98);
		stat->SetY1NDC(0.77); stat->SetY2NDC(0.92);
		gPad->Update();
  		c3->SaveAs("C:/si-calo-sep18/Fit_x-z_33-35-37.pdf");
but I get the error
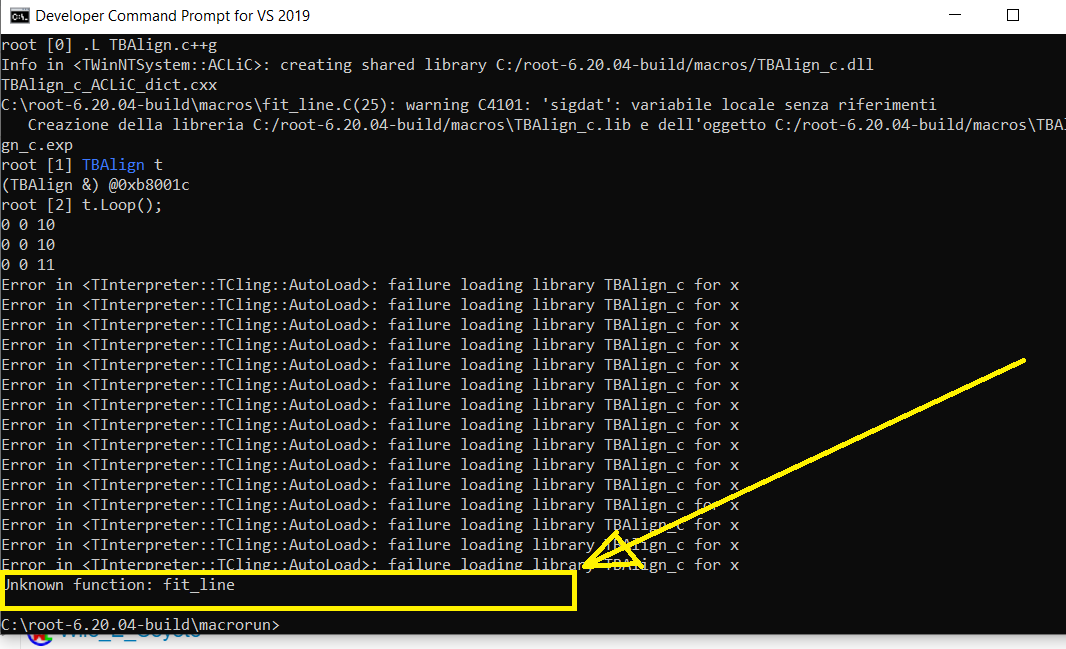
it says that fit_line isn’t defined…but I included the fit_line.c file…
TBAlign.C (23.0 KB) TBAlign.h (4.3 KB) fit_line.C (1.2 KB)
I also tried to comment the lines
const char *f_name = "fit_line"; // standard ROOT linear function
  		g->Fit(f_name, ""); // e.g. "" or "Q" or "V"
leg->AddEntry(f_name, "Fit", "l");  //TO USE FOR 2 GAUSSIAN FIT
to see what it happens, but in this way I see for few second a plot having just 3 points (instead I should get many points) and after few seconds the macro crashes…
Do you know how to fix please?
Try to play with this “example.cxx” macro:
#include "fit_line.C"
#include <iostream>

void example() {
  float z[] = {1873.93, 1995.43, 2125.43}; // z coordinates of 33, 35, 37
  float x[] = {-7.0, -13.5, -20.5}; // x coordinates of hits (an example)
  float ex[] = {0.1, 0.1, 0.1}; // errors of x coordinates of hits
  int n = 3; // number of data points (2 or 3)
  float a, b, ae, be, chi2, q;

  fit_line(z, x, n, ex, a, b, ae, be, chi2, q); // hits x versus z
  std::cout << "chi2 = " << chi2 << std::endl;
  std::cout << "ndf = " << (n - 2) << std::endl;
  std::cout << "prob = " << q << std::endl;
  std::cout << "a = " << a << " +- " << ae << std::endl;
  std::cout << "b = " << b << " +- " << be << std::endl;
}
Thank you @Wile_E_Coyote. The problem is that in your macro you wrote
float x[] = {-7.0, -13.5, -20.5}; // x coordinates of hits (an example)
That is what I did 2 days ago, but in this way I don’t get event by event plot!
In the ROOT file I’ve the arrays:
x33[0] constituted by 4832 events in the range [-12, -3]
x35[0] consituted by 4984 events in the range [-18, -10]
x37[0] consituted by 4661 events in range [-30, -16]
My supervisor wants that I set
x[0]=x33[0]
x[1]=x35[0]
x[2]=x37[0]
so, in the z-x plane I have
a. 4832 points Ai=(1873.93, x[0])
b. 4984 pointa Bi=(1995.43, x[1])
c. 4661 points Ci=(2125.43, x[2])
My supervisor wrote me:
One event is constituted by the points Ai, Bi, Ci, it can happen
a. More points in a silicum layer (due to inefficiency);
b. No points in a layer
c. 3 points (one for each layer). In this case you a linear fit for the three points.
For example Linear regression - WikipediaYou must find a,b for EACH event
That’s because I can’t use the line
float x[] = {-7.0, -13.5, -20.5}; // x coordinates of hits (an example)
that is what I did 2 days ago!
You can modify all “x” values at any moment, e.g.:
x[0] = -7.0; x[1] = -13.5; x[2] = -20.5;
thank you @Wile_E_Coyote
I know that I can modify the x values …but I have more than 4 thousand values for each silicon tracker. So, I can’t do thousands plots…
I guess that, in a single plot, the macro should plots all the 4832 x[0] values at z=1873.93, all the 4984 values at z=1995.43 and all the 4661 x[2] values at z= 2125.43.
Or not?
Hi @Wile_E_Coyote. My supervisor replied
He said that
- One event is a triad x={x33,x35,x37} where x33,x35, and x37 are the x coordinates of the hit at z=1873.93, z= 1995.43 and z=2125.43.
- Each ROOT entry is an event…
- I’ve not plot the events, but just calculate the a, b parameters of the fit.
Then, opening the ROOT file, I see that I’ve 5237 entries, so I guess, that I’ve 5237 events, then I can’t write by hand 5237 times the coordinate values…
Then the code, should
- Open the Root File
- Read the arrays x33[0], x35[0] and x37[0]. They have 5237 rows.
- Set z33=1873.93, z35= 1995.43 and z37=2125.43.
- For each row of the arrays I’ve three points to fit by the fit_line function
- Print on a file the 5237 values of the parameters a,b
So, for example let’s say that the first row of x is x1={-12, -18,-30} and the second one x2={-10, -16, -28} , I’ve to fit
- The three points A1=(1873.93, -12), B1=(1995.43, -18), C1=(2125.43, -30) get the parameters a1, b1 and print them on a txt/dat file
- The three points A2=(1873.93, -10), B1=(1995.43, -16), C1=(2125.43, -28) get the parameters a2, b2 and print them on a txt/dat file
and so on for all the 5237 rows of the file.
Please, can you help me to do that?