Hi @asopio ,
Great! We did something right between releases ![]()
Yes, it’s easy to verify with valgrind --tool=massif. These are the largest memory hoggers it sees (thank you for the self-contained reproducer):
12.15% (30,056,448B) 0x9E43CA4: llvm::BumpPtrAllocatorImpl<llvm::MallocAllocator, 4096ul, 4096ul>::Allocate(unsigned long, unsigned long) [clone .constprop.0] (in /home/blue/ROOT/master/cmake-build-foo/lib/libCling.so)
06.47% (15,994,384B) 0x7DBB588: clang::ASTReader::ReadASTBlock(clang::serialization::ModuleFile&, unsigned int) (in /home/blue/ROOT/master/cmake-build-foo/lib/libCling.so)
06.41% (15,848,928B) 0x7DBBAE5: clang::ASTReader::ReadASTBlock(clang::serialization::ModuleFile&, unsigned int) (in /home/blue/ROOT/master/cmake-build-foo/lib/libCling.so)
05.33% (13,189,120B) 0x9D093D8: llvm::BumpPtrAllocatorImpl<llvm::MallocAllocator, 4096ul, 4096ul>::Allocate(unsigned long, unsigned long) [clone .constprop.1] (in /home/blue/ROOT/master/cmake-build-foo/lib/libCling.so)
05.21% (12,875,749B) 0xA4005F8: llvm::Module::getOrInsertComdat(llvm::StringRef) (in /home/blue/ROOT/master/cmake-build-foo/lib/libCling.so)
05.07% (12,549,184B) 0x7160CC2: llvm::safe_malloc(unsigned long) (MemAlloc.h:26)
03.83% (9,461,760B) 0x9D16DD8: llvm::BumpPtrAllocatorImpl<llvm::MallocAllocator, 4096ul, 4096ul>::Allocate(unsigned long, unsigned long) [clone .constprop.0] (in /home/blue/ROOT/master/cmake-build-foo/lib/libCling.so)
03.39% (8,380,856B) 0xA4FA33A: llvm::SmallVectorBase::grow_pod(void*, unsigned long, unsigned long) (in /home/blue/ROOT/master/cmake-build-foo/lib/libCling.so)
03.25% (8,032,344B) 0xA4EF7E1: llvm::WritableMemoryBuffer::getNewUninitMemBuffer(unsigned long, llvm::Twine const&) (in /home/blue/ROOT/master/cmake-build-foo/lib/libCling.so)
etc. etc. (the percentages indicate the fraction of the memory allocated by the process that was allocated by that particular call, the biggest offender is llvm::BumpPtrAllocatorImpl at 12%).
Just-in-time-compiled code is added to an in-memory “shared library”, and Cling, the interpreter, provides no way to unload code once it’s there. On the RDataFrame side we try to maximize jitted code re-use.
Further mitigations
Besides using the latest ROOT release which is a bit more well-behaved, you can use, instead of rdf = rdf.Filter("eventNumber>367927315"), something like:
ROOT.gInterpreter.Declare("""
ROOT::RDF::RNode ApplyFilter(ROOT::RDF::RNode df) {
    return df.Filter([](int e) { return e>367927315; }, {"eventNumber"});
}
""")
...
rdf = ROOT.ApplyFilter(ROOT.RDF.AsRNode(rdf))
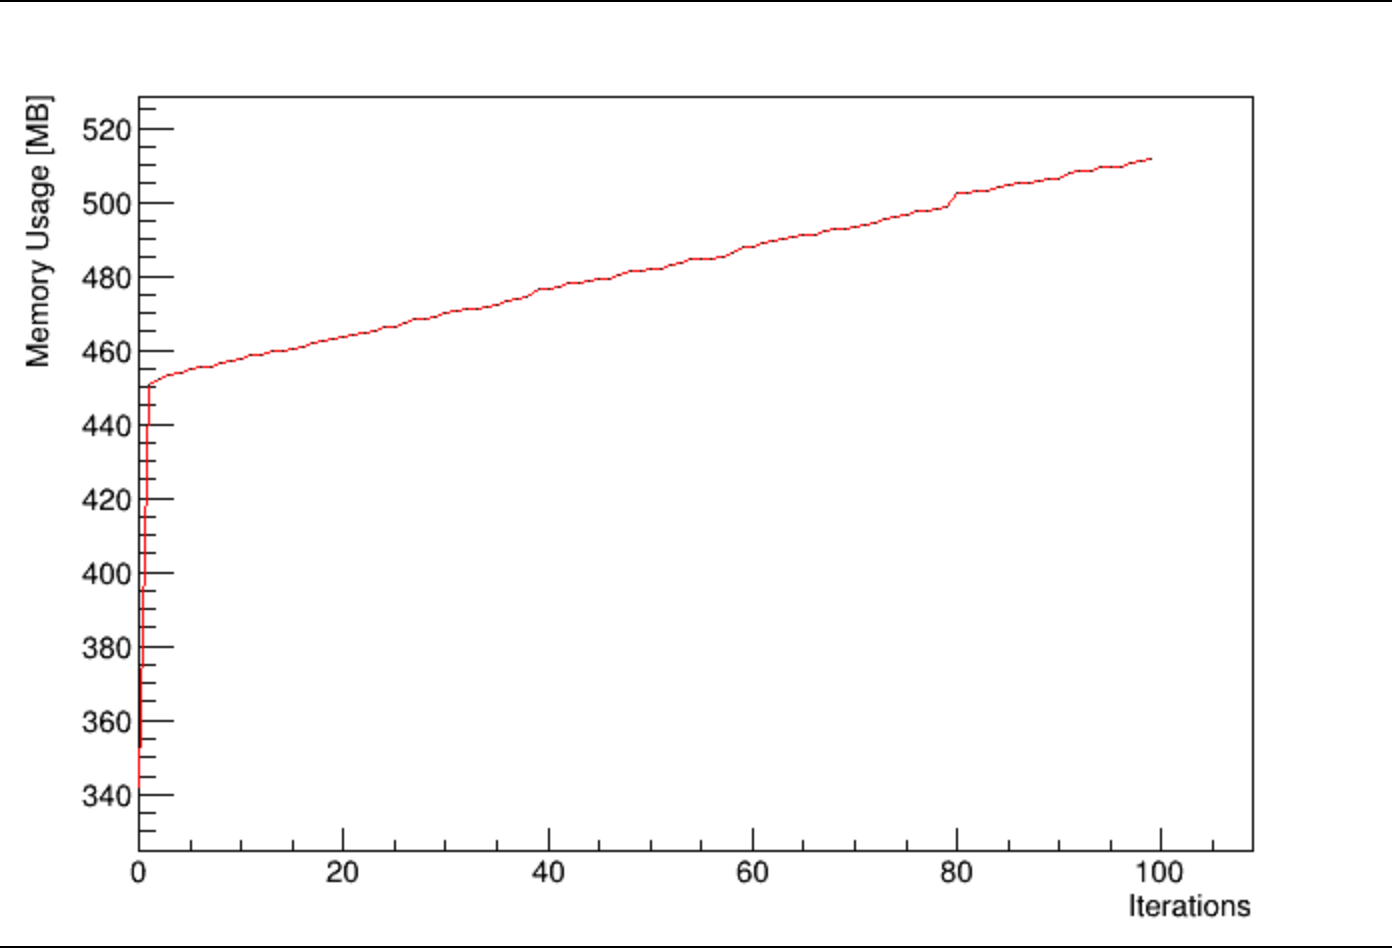
With that trick we just-in-time-compile the RDF transformation you need only once, then re-use it many times (note that we need to use a C++ lambda inside the Filter there otherwise we are back to the original situation). On my machine this is the situation with your original reproducer:
and this is with the change mentioned above:
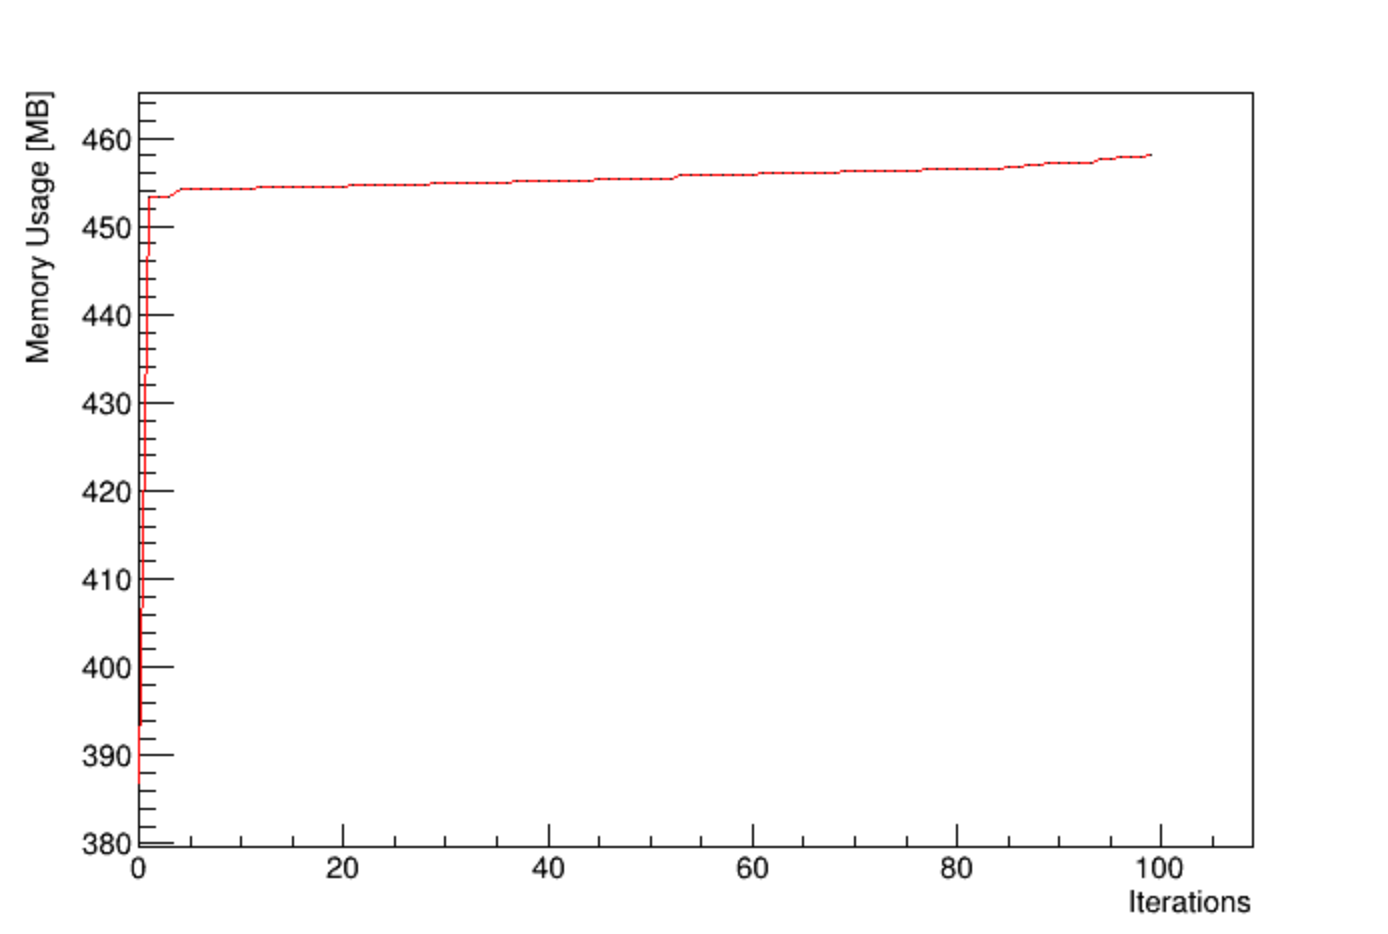
There is still a little bit of memory creep because AsNumpy does a little bit of jitting as well.
The other thing you can do is run each iteration of your loop in a sub-process. When the sub-process ends, it deallocates all related memory.
Cheers,
Enrico