Hello, thanks for your answer. Yes i realised that the two first line was useless but I keep it here for when I’m using TTree::Print::Scan … What i don’t understand is more about data propriety than code I think. I don’t understand the result. I’ll try to be as clear as possible. As you can see when I use the fonction TTree::Scan(), detections happen completely randomly, once per event. But when I use the code I sent you, there are whole line appearing, I can’t understand how can it correspond to TTree::Print().
Do you understand my problem ?
Dear @KillianUB ,
Every line of the output corresponds to one iteration of the for loop. That also corresponds to one entire event. Your Branch Psd_All_Shift contains per each event an array. As you have already shown before, this branch contains arrays of 34 elements. Thus, for every line, you see the entire array of 34 elements printed. That corresponds exactly to what TTree::Scan is showing, just that the Scan method explodes the array vertically showing the same event on multiple rows. Is that clear enough?
I feel really embarrassed and sorry but no. I’ve understood what was showing TTree::Scan(), it shows 34 time the same event for each detectors. The code I made get those 34 Instance in one array. Bu why is there several times the same ligne ? It get the 34 detectors in only one array so each detections should appears only once ?
Dear @KillianUB ,
Those should not be the same line/event/row. Every line you see printed is a different event/row from the result of the Take operation. If you are referring to the fact that it appears to be the same values of each line, maybe multiple events present the same value, I wouldn’t know, that depends on your dataset.
it shows 34 time the same event for each detectors.
Yes, and also Take does. It shows 34 values for the same event, I guess every one of those 34 values represents a different detector. Again, this knowledge should come from your side unfortunately I cannot know more than you about the dataset schema.
Hello, thank’s for your help, I finally got what I wanted using this code ;
// Ouvrir le fichier ROOT
TFile f("RAW148OS_treeFF01.root");

// Obtenir l'arbre TTree depuis le fichier
TTree* tree = dynamic_cast<TTree*>(f.Get("Analysis_All"));

// Créer un RDataFrame à partir de l'arbre TTree
ROOT::RDataFrame d(*tree);

// Prendre la colonne RVec<UShort_t> "Psd_All_Shift"
auto rvec = d.Take<ROOT::VecOps::RVec<UShort_t>>("Psd_All_Shift");

// Créer un histogramme
TH1D *hist = new TH1D("hist", "N(n)", 10, 0, 10);

// Boucle sur les vecteurs de données
for (const auto& pt : rvec) {
    // Compter le nombre de valeurs supérieures à zéro dans chaque vecteur
    int count_good_pts = 0;
    for (UShort_t val : pt) {
        if (val > 0) {
            count_good_pts++;
        }
    }

    // Remplir l'histogramme avec le nombre de valeurs good_pts
    hist->Fill(count_good_pts);

    // Afficher le nombre de valeurs supérieures à zéro dans chaque vecteur
    std::cout << "Nombre de valeurs supérieures à zéro : " << count_good_pts << std::endl;
}
// Diviser le nombre de valeurs good_pts par 33
        double count_good_pts_divided = static_cast<double>(count_good_pts) / 33.0;

// Créer un canvas pour afficher l'histogramme
TCanvas *canvas = new TCanvas("canvas", "Canvas", 800, 600);

// Dessiner l'histogramme sur le canvas
hist->Draw();

// Afficher le canvas
canvas->Draw();
}
And it returns me ;
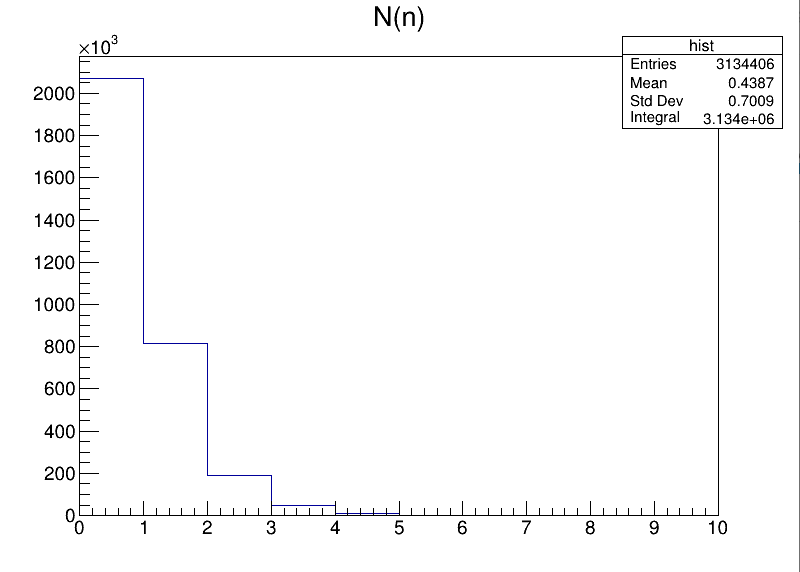
Wish is exacltly what I wanted !
Dear @KillianUB ,
I am glad you reached a satisfactory solution. Here is a shortened version, keep in mind that one of powers of RDataFrame is exactly removing the need for the raw for-loops
ROOT::RDataFrame df{"Analysis_All", "RAW148OS_treeFF01.root"};

auto count_good = df.Define("count_good_pts", [](const ROOT::RVec<UShort_t> &vec) { return ROOT::VecOps::Sum(vec > 0); }, {"Psd_All_Shift"});

auto hist = count_good.Histo1D({"hist", "N(n)", 10, 0, 10}, "count_good_pts");

TCanvas *canvas = new TCanvas("canvas", "Canvas", 800, 600);

// Dessiner l'histogramme sur le canvas
hist->Draw();

// Afficher le canvas
canvas->Draw();
Cheers,
Vincenzo
Thank you very much for the tunned version. This is my very first steps on ROOT and C++, I’ll keep studying I have so much to learn.