Thanks @Wile_E_Coyote.
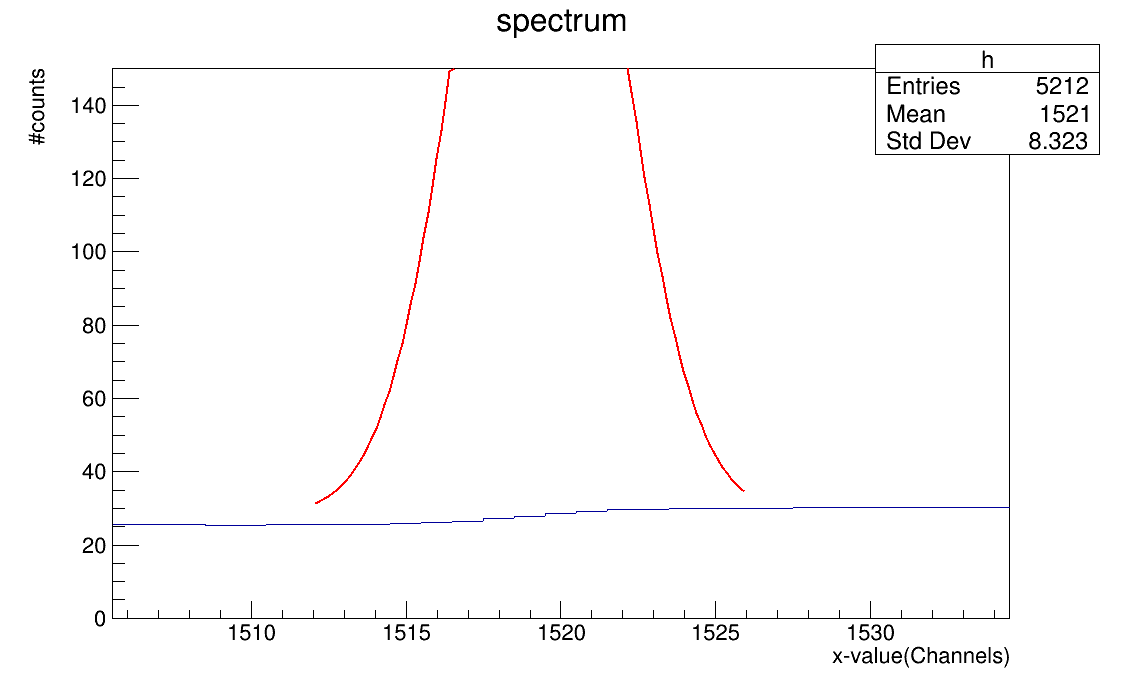
This is one of the fitted peak in the spectrum(red)
I think background is eliminated but i’m still not sure about the blue line in the spectrum.
Looking at my code could you please elaborate what does this blue line signifies?
fithisto.C (3.4 KB)
Thanks @Wile_E_Coyote.
please tell me about this blue line also.
// Estimate the background
s->Background(source,nbins,6,TSpectrum::kBackIncreasingWindow,
TSpectrum::kBackOrder2,kFALSE,
TSpectrum::kBackSmoothing3,kFALSE);
// Draw the estimated background
for (i = 0; i < nbins; i++) d->SetBinContent(i + 1,source[i]);
d->SetLineColor(kRed);
d->Draw(“SAME L”);
In Example 1 script Background_incr.C:
- they are estimating the background and then they are drawing it.
In the same way, I am thinking that this blue line is showing the estimated background.
Am I right? If not then please correct me.