Alternative question:
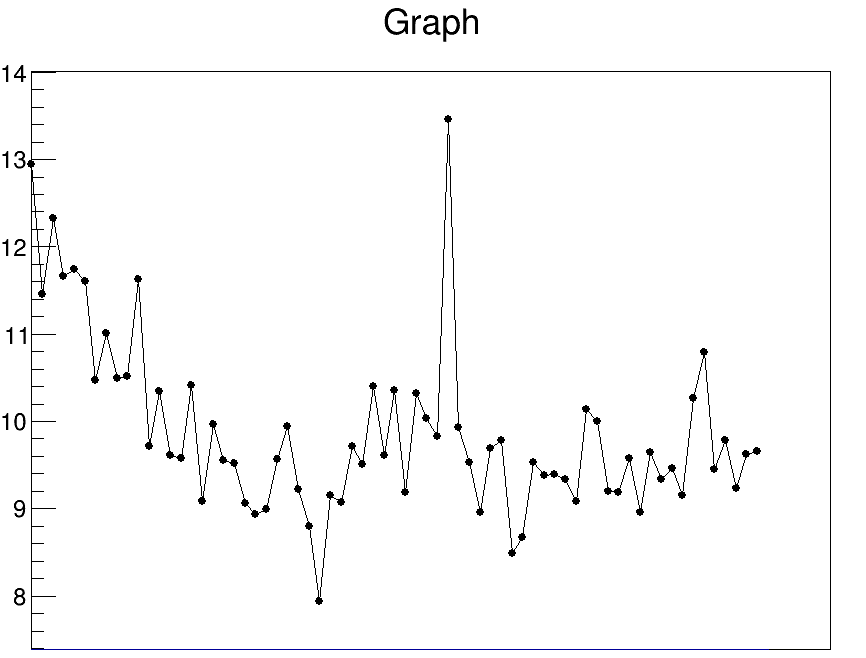
I can draw a graph:
and a histogram:
But not both in one canvas/one run of the macro. If I put any option in the histogram’s Draw(), the graph stays, and if I pass no options to the histogram’s Draw(), the histogram is drawn as in the second image. I’ve tried Draw(“SAME”)