Doing Statistics with TH1

I draw TH2 for two purposes (to see the distribution and extract the statistics like mean and sd)
However, when I got two different answers when I:

a) choose the range of the plot to be automatic (using two same parameters), for eg: TH2F("h","h",50,100,100,50,40,40)
I suppose it should select the range that covers all of my data

b) chose the range normally, for eg:TH2F("h","h",50,-100,100,50,-40,40)
for this, I am (quite) sure that the selected range has included all the data (by trying several ranges and inspect the ranges visually)

I am wondering whether using TH1 (or TH2) for doing (simple) statistics is a good practice to do ? Or maybe there is some other things that is outside of my knowledge?


_ROOT Version: 6.24 (PyROOT via conda)
_Platform:Centos7
_Compiler: gcc9


Hi @NgJunKai,

how are you retrieving the mean and standard deviation from the histogram? According to the documentation of TH1::GetMean() and TH1::GetStdDev(), it will return you the statistics for the original unbinned dataset that was used to fill the histogram, which should not depend on the binning.

So I’m a bit surprised by your finding. Can you maybe share your code to reproduce these differences?

Yes, I used TH1::GetMean() and TH1::GetStdDev() ,and TH2::GetCovariance() as well.
My code are quite long, let me take some time to extract the key steps …
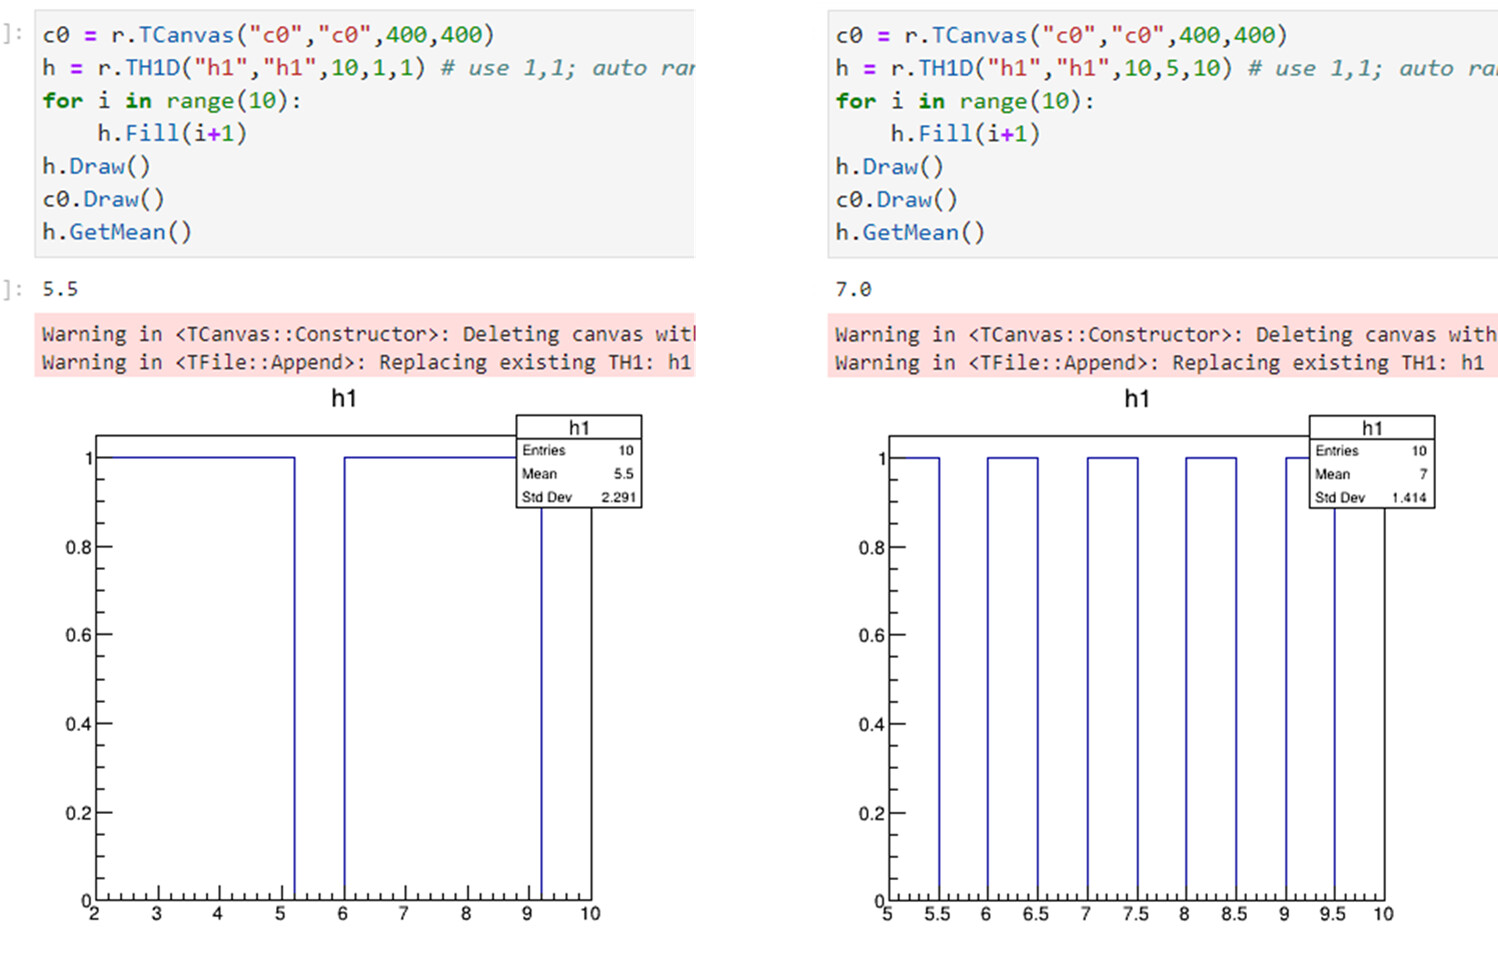
meanwhile, I can provide a simple test that demonstrate this behaviour (that seems to be contradicting the independence of the statistics on the binning), see the atttached figure.

Okay, thanks! That’s enough code for me to reproduce the problem already.

After reading again the TH1 docs, I understand now that the statistics are only computed for the unbinned dataset if you have not specified the binning range, just like you do with your TH1D(.., 10, 1, 1) example. As soon as you set the binning range, your statistics will be computed binned, and hence biased by binning effects.

If you want to compute the statistics unbinned and then still use your user-defined binning for plotting, you have to set the range only after filling the histogram, and not in the constructor:

auto h1 = new TH1D{"h1", "h1", 10, 1, 1};
auto h2 = new TH1D{"h2", "h2", 10, 1, 1};

for(std::size_t i = 0; i < 10; ++i) {
    h1->Fill(i+1);
    h2->Fill(i+1);
}

std::cout << h1->GetMean() << "   " << h2->GetMean() << std::endl;
std::cout << h1->GetStdDev() << "   " << h2->GetStdDev() << std::endl;

h2->GetXaxis()->Set(10, 5, 10);

auto c1 = new TCanvas{"c1", "c1", 800, 400};
c1->Divide(2);

c1->cd(1);
h1->Draw();

c1->cd(2);
h2->Draw();

c1->Draw();

That also means that the statistics shown in the statbox in the plot will always be binned.

I hope that clarifies things a bit!

Thanks, it’s clear now (and I have reproduced your code in python).

I’ve also found another way (without reseting the binning range) by calling the static function TH1::StatOverflows(kTRUE), so that the under/overflow bins are always computed.

However, it seems like the results are biased (perhaps the data was still binned) even I did it with TH1D(.., 10, 1, 1). I have checked this behaviour with TH1::StatOverflows(kTRUE) turned on and off. Histogram produced by this method returned the correct std (which i checked with numpy) if I call TH1::StatOverflows(kTRUE)

This conclusion is wrong.

The histograms in the first and the third posts here have different x-ranges. By default, histogram statistics is calculated (at filling time, always unbinned) only for entries inside of the x-range (i.e., excluding under- and over-flows).

1 Like

By default, histogram statistics is calculated (at filling time, unbinned) only for entries inside of the x-range (i.e., excluding under- and over-flows).

What do you mean with “by default”? What I observe is that if you specify a range in the constructor (with is the default usecase), the statistics are calculated binned and not unbinned. The only way I found to get unbinned statistics is to not specify the range (i.e., do as @NgJunKai and have xlow == xhigh in the constructor)

Here to illustrate what I mean:

auto h1 = new TH1D{"h1", "h1", 10, 1, 1};
auto h2 = new TH1D{"h2", "h2", 2, 0, 11};

for(std::size_t i = 0; i < 10; ++i) {
    h1->Fill(i+1);
    h2->Fill(i+1);
}

std::cout << h1->GetMean() << "   " << h2->GetMean() << std::endl;
std::cout << h1->GetStdDev() << "   " << h2->GetStdDev() << std::endl;

The output is

5.5   5.5
2.29129   2.87228

So even though the range specified in the constructor results in no under- and overflow, the standard deviation is biased by binning effects, which showed me that it was computed binned. Hence my conclusion that you claimed is wrong. But I’m also not an expert with the hist classes to be honest, and maybe we mean the same thing anyway!

TH1::StatOverflows

TH1::GetStatOverflows
TH1::SetStatOverflows
TH1::EStatOverflows

BTW. @jonas Before the “for” loop, add: TH1::StatOverflows(kTRUE);

Ah I see now, you’re right!

Okay, so by default the statistics are computed unbinned, excluding under- and overflow.

I think now I understand why the case where no range is specified gives a different result (the TH1D{..., 10, 1, 1} case). The automatic binning that is chosen goes from 2 to 10, so it actually has over- and underflows, which are not considered unless you use StatOverflows(true).

Right?

After you’ve filled and drawn the histogram with “automatic binning”, check its “xlow” and “xup”. Do remember that, the “Convention for numbering bins” explicitly says: the “first bin with low-edge xlow INCLUDED” and the “last bin with upper-edge xup EXCLUDED” (i.e., the “xup” belongs to the “overflow bin”).

1 Like

Thanks @jonas and @Wile_E_Coyote. I have learnt a lot from the discussions.

@NgJunKai See also: TH1::ResetStats and: TH1::GetStats

1 Like

This topic was automatically closed 14 days after the last reply. New replies are no longer allowed.