I have to say that this pdf bad rendering in the “pdf output” also affects all Linux pdf readers like “evince”, “atril”, “inkscape”, not only MAC’s “preview”.
In the meanwhile, I have made some improvements for .tex workaround:
-
With pdflatex, if the 2D histogram had a lot of bins, then the conversion “crashed” due to exceeded memory capacity. The trick is to use “lualatex” instead, which does not have that problem and produces equivalent plots. It is already installed by default eg in Linux. Just change in the command line the program you execute.
-
I have created a simple macro to automize the “.tex” to “.pdf” conversion, maybe delaossa you are interested for doing this in all your plots. You can adapt it to your needs.
Execute as root -l -b -q autoconvert.cpp
/**
* \brief Save a canvas as .tex, then convert it to .pdf via pdflatex or lualatex
* \param c pointer to the TCanvas
* \param output the output name (.pdf)
* \note the intermediate tex figure and skeleton are also saved (.tex) in /tmp. Adapt to your needs this function.
*/
void SaveAsTikz(TCanvas* const c, const TString output)
{
if(!c) return;
if(!output.EndsWith(".pdf",TString::kIgnoreCase)) return;
const TString texName = "/tmp/"+TString(output).ReplaceAll(".pdf",".tex");
const TString skelName= "/tmp/"+TString(output).ReplaceAll(".pdf","_skeleton.tex");
c->SaveAs(texName);
//Now we create the skeleton tex file
TString s =
"\\documentclass[crop,tikz]{standalone}\n"
"\\usepackage{tikz}\n"
"\\usetikzlibrary{patterns,plotmarks}\n"
"\\begin{document}\n"
"\\input{";
s+=texName+
"}\n"
"\\end{document}";
cout << texName << " " << skelName << endl;
ofstream g(skelName);//or "/tmp/" + tmpName
g << s << endl;
g.close();
//gSystem->ChangeDirectory("/tmp");//To use sth like that if you want to change the subdirectory structure
gSystem->Exec("lualatex -job-name="+output+" "+skelName);
}
void autoconvert()
{
TCanvas* c = new TCanvas();
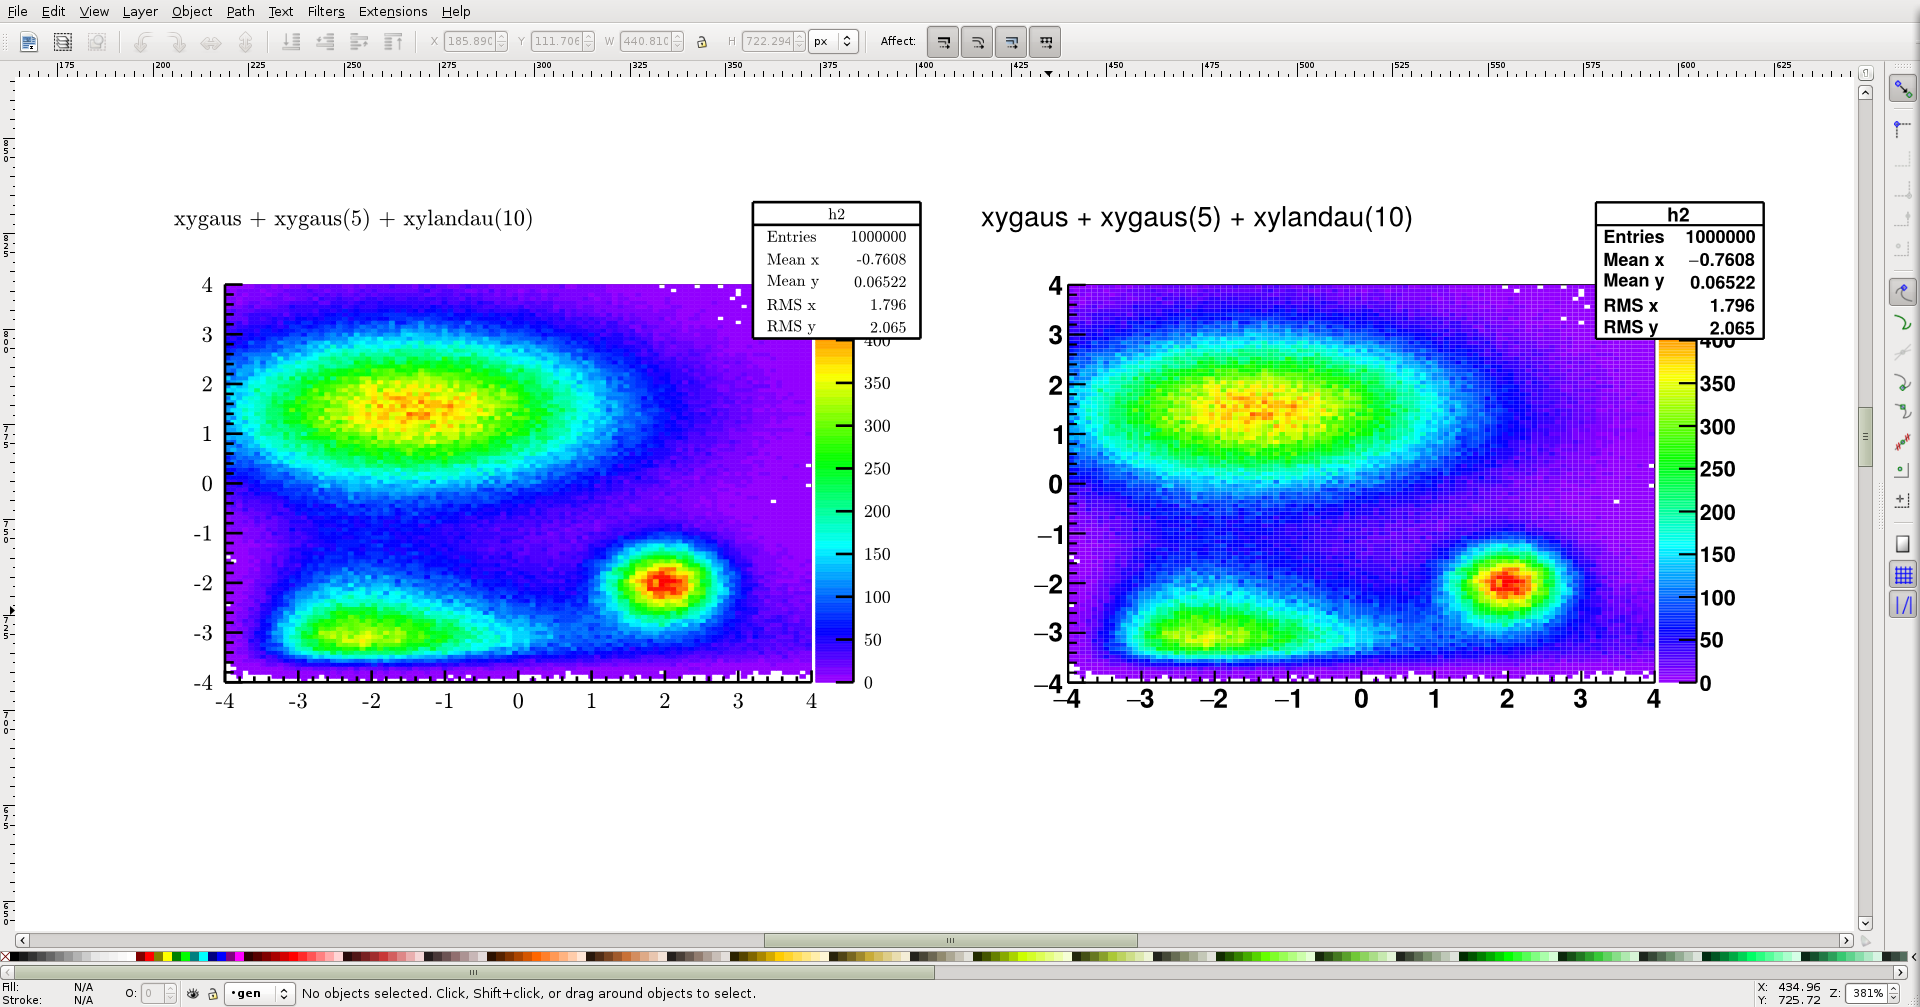
TF2 *f2 = new TF2("f2","xygaus + xygaus(5) + xylandau(10)",-4,4,-4,4);
Double_t params[] = {130,-1.4,1.8,1.5,1, 150,2,0.5,-2,0.5, 3600,-2,0.7,-3,0.3};
f2->SetParameters(params);
TH2F* h2 = new TH2F("h2","xygaus + xygaus(5) + xylandau(10)",100,-4,4,100,-4,4);
h2->FillRandom("f2",1000000);
h2->Draw("COLZ");
SaveAsTikz(c,"a.pdf");
//~ c->SaveAs("a.tex");
//~ c->SaveAs("b.pdf");
}Additionally, if you use a latex document for your paper, you can skip this workaorund, just call c->SaveAs(".tex") and directly insert the figures in your code as “.tex” instead of previously converting to pdf. See “tikzexternal” for not slowing down your compilation time. I have chosen the mode “list and make” and it works flawlessly.
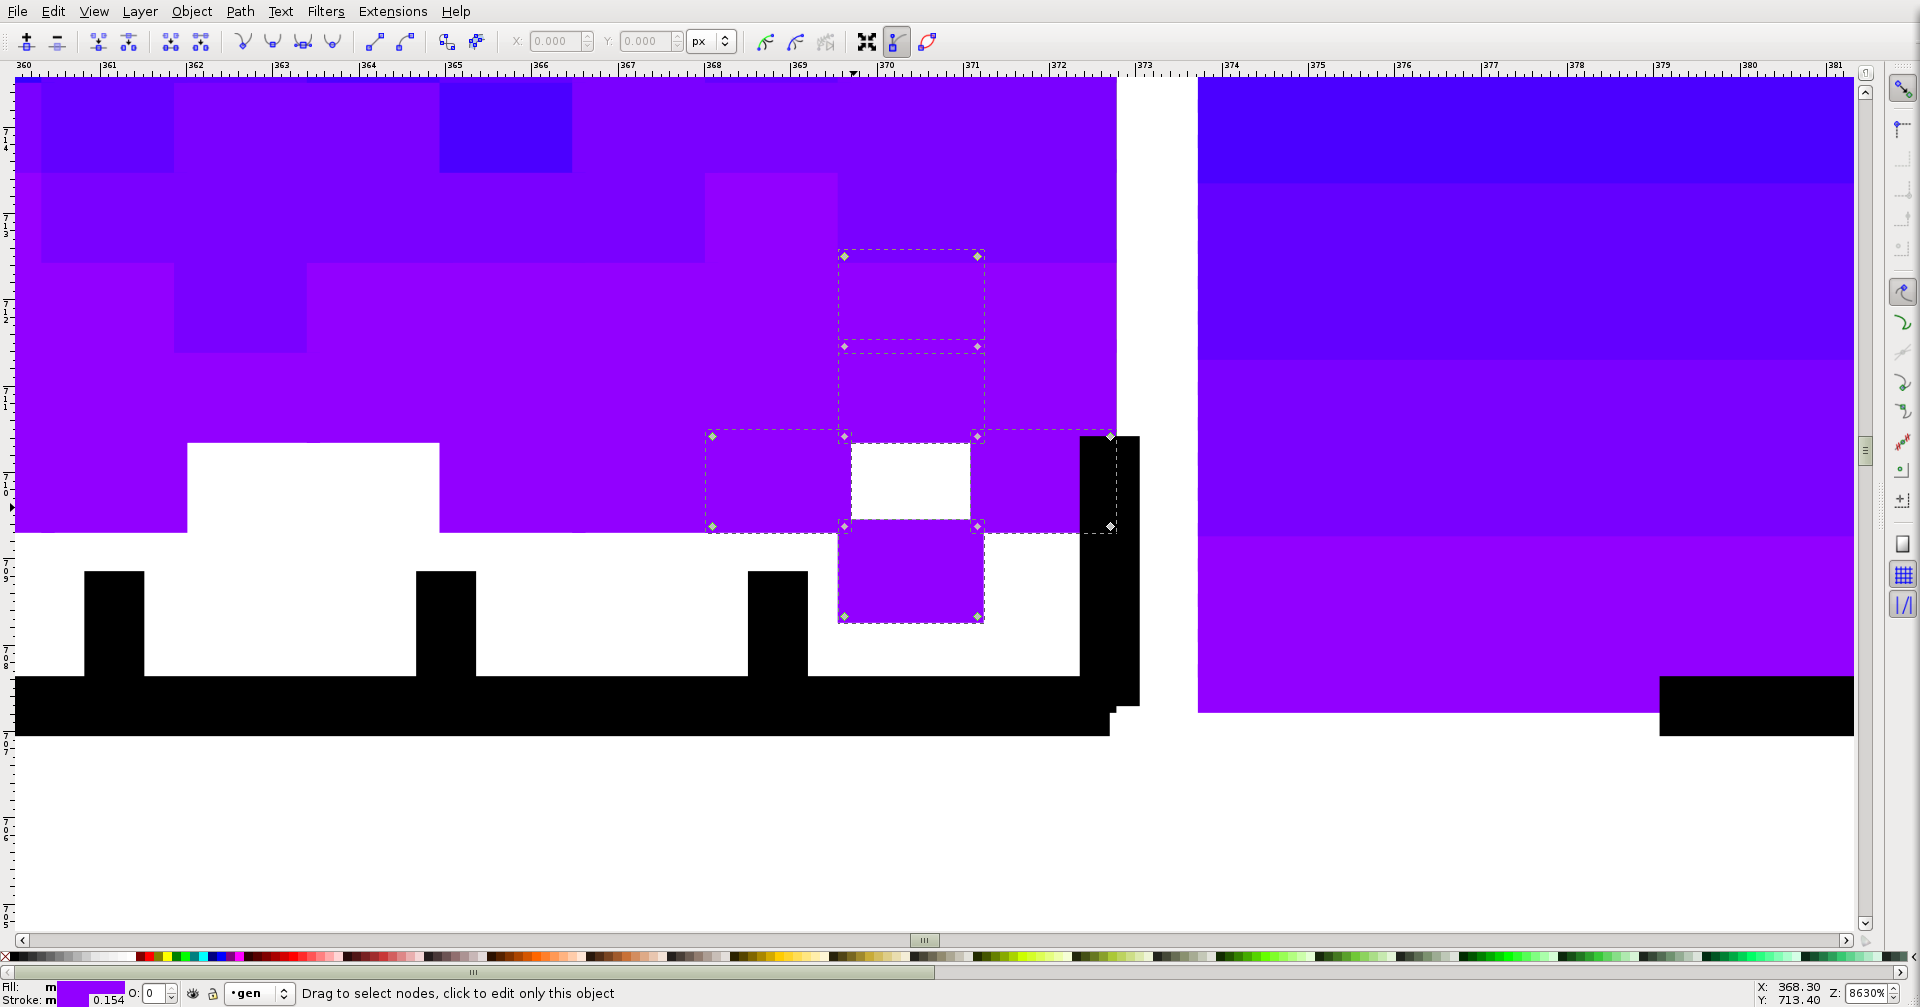
\tikzexternalize[mode=list and make, prefix=i/]Couet, concerning the issue of the pdf rendering, I have analysed more in depth the problem via the xml code of inkscape. (Open h2.pdf as inkscape and then open xml editor). I have chosen the same bin rectangle (the most right bottom one) in the respective figures of h2.pdf.
Left plot (tikz)
d m 477.92722,63.05365 0,2.69125 3.96855,0 0,-2.69125 -3.96855,0 z
id path690
style fill:#9200ff;fill-opacity:1;fill-rule:nonzero;stroke:#9200ff;stroke-opacity:1;stroke-width:0.3985;stroke-linecap:butt;stroke-linejoin:miter;stroke-miterlimit:10;stroke-dasharray:none
rectangle width x height = 1.692x1.197
Right plot (save as pdf)
d m 477.921,63.0529 3.9685,0 0,2.69128 -3.9685,0 0,-2.69128 z
id path41838
style fill:#9200ff;fill-opacity:1;fill-rule:evenodd;stroke:none
rectangle widthxheight = 1.538x1.043
So I think that the issue is clear, the rectangles in tikz are bigger in size than in saveaspdf, so that they partially overlap each other and make the white lines disappear. The question is, why are the rectangles in tikz bigger? The trick is the fill style: they have a “border stroke line” instead of just the interior fill. This makes them bigger. So, if one just changes the style fill recursively in the xml adding the same stroke as in tikz, then the new rectangle WxH = 1.692x1.197, i.e. the same as tikz.
In summary, if one could say in the TPDF class that the rectangles are not only a fill, but also a stroke of the same color, and takes an equivalent stroke-width as in TTexDump, then both figures should be equivalent.
Of course, mathematically the TPDF seems better because the rectangles do not overlap, but I guess that when coming to real world, the limited precision of floats or whatever makes that the perfect-mathematical-overlapping of rectangles leave some 0.0001 gaps that produce white lines. So maybe it is just an internal “rounding” error of most pdf viewers.
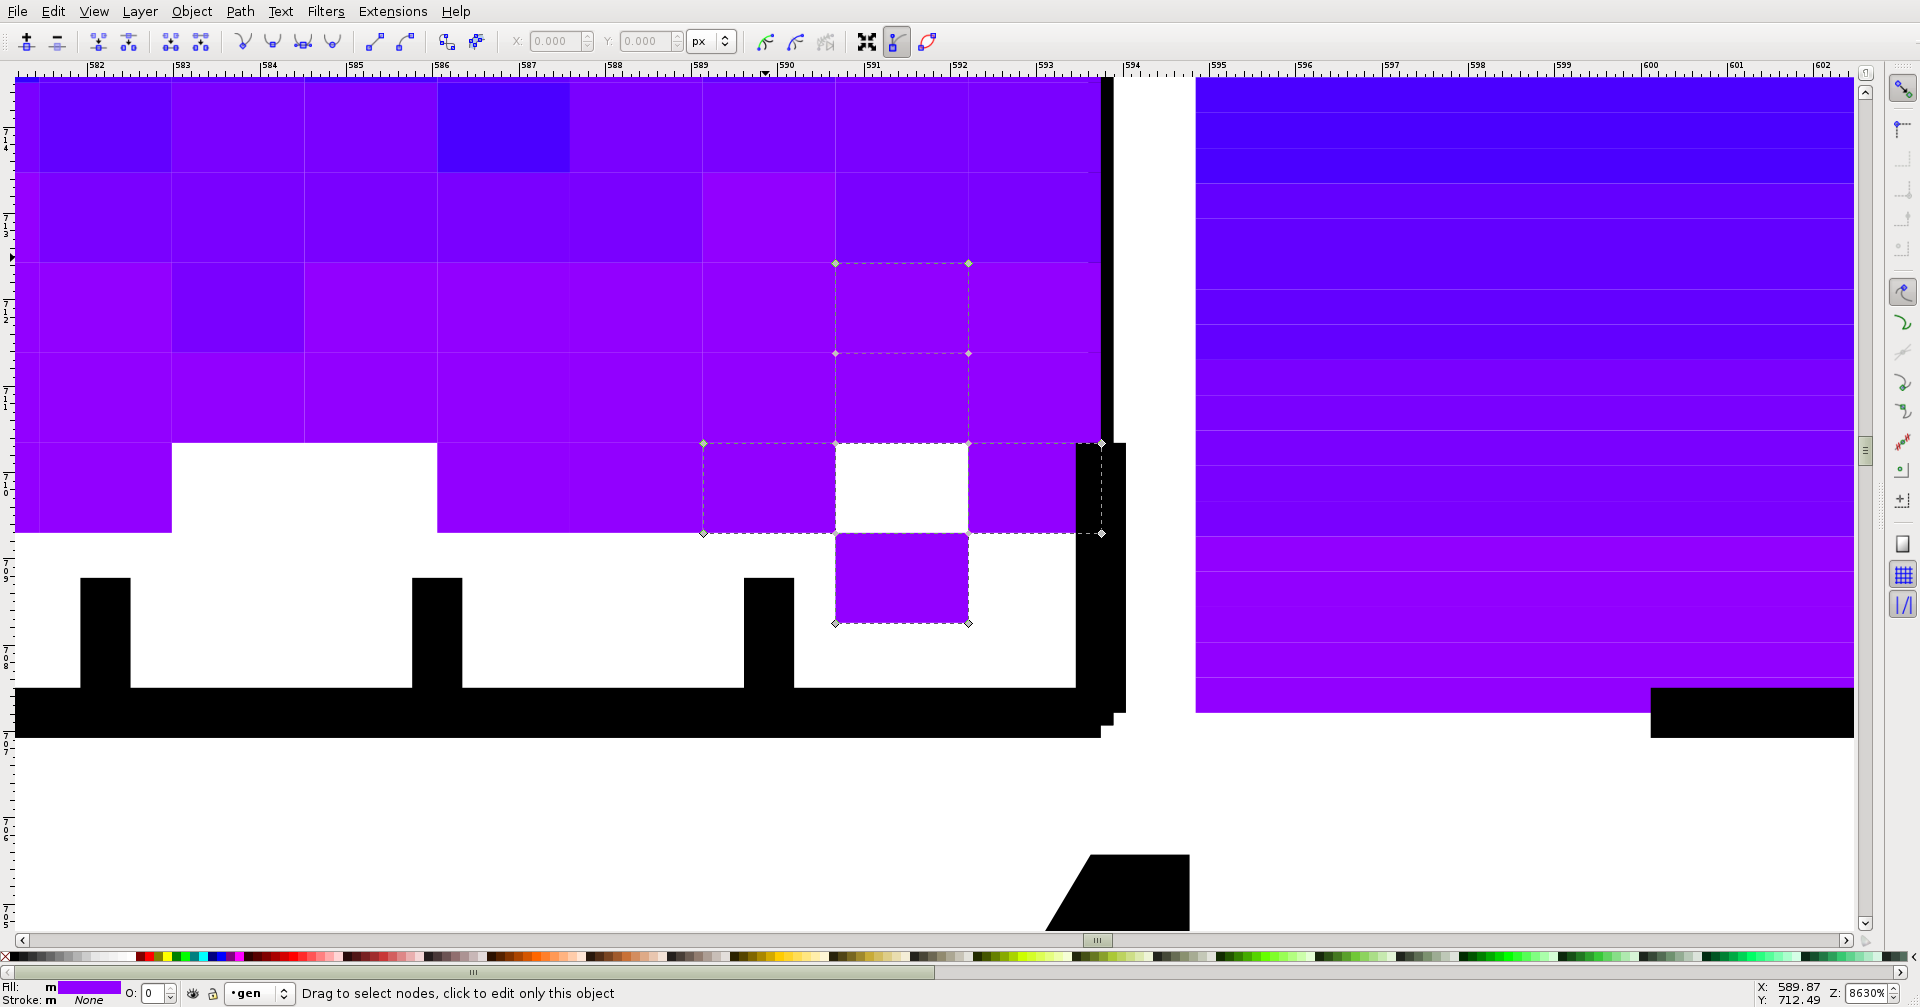
As final example, right figure:
Rectangle 1: Y = 710.338, heightY = 1.043  ---> endingY = 710.338+1.043 = 711.381
Rectangle 2: Y = 711.381, heightY = 1.043
left tikz figure:
Rectangle 1: Y=710.339, heightY=1.197 --> endingY = 711.536
Rectangle 2: Y =711.381, heightY=1.197
Attached figure comparing overlapping structure is seen. I agree with couet that the problem is from the pdf viewers, but I suggest to implement in ROOT following provisional workaround until the viewers correct it:
The function SaveAs can take “options” given by the user:
SaveAs(const char* filename = “”, Option_t* option = “”)
If I all c->SaveAs(".pdf",“STROKE”), then stroke is added to the rectangles of the pdf output when exporting the 2D COLZ histogram . The function TPDF::DrawBox should be modified accordingly.
Or if one has contact with people developing pdf readers, maybe it is the same buggy library used in all open source pdf viewers…?