Hi Axel, first, thanks for your reply.
-
Root 5.34/38 Windows
-
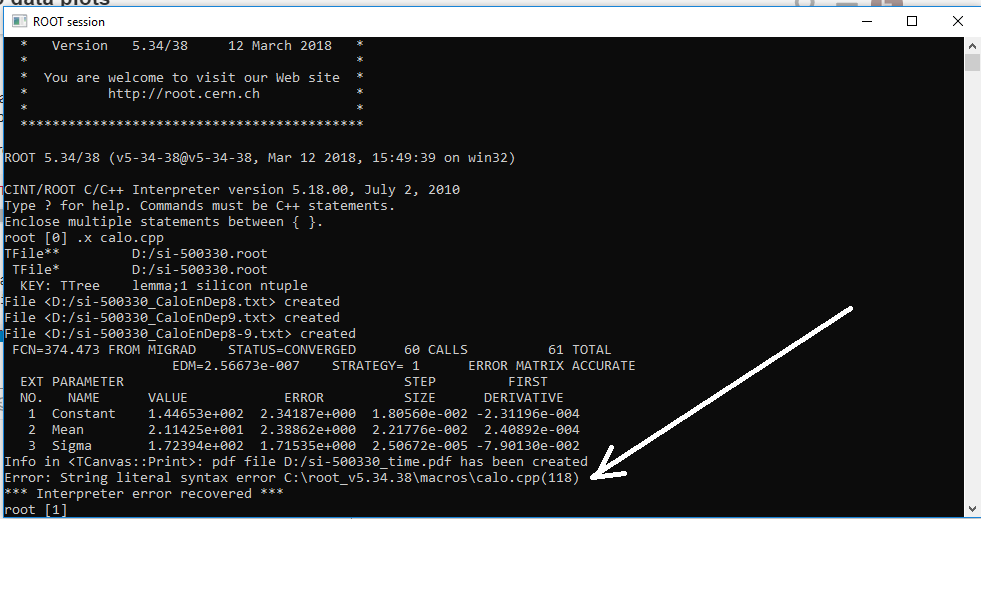
About the error see the attachment
-
Yes, I want to write
Calo_Time[a]-Calo_Time[b]> p1-3*p2 && Calo_Time[a]-Calo_Time[b] < p1+3*p2?, I used the call toFormbecause of I defined the variablesa,bat the beginning of the macro so that I can modify them quickly (this because I also will study Calo_Time[10]-Calo_Time[15], etc. etc]. TheFormfunction works fine in the rowt->Draw(Form("Calo_Time[%d]-Calo_Time[%d]",a,b));(cuet wrote me this code here Differences between arrays) -
I just saw that the error was given because of I forgot the
Formhereif ("Calo_Time[%d]-Calo_Time[%d]",a,b))> (p1-3*p2) && (Form("Calo_Time[%d]-Calo_Time[%d]",a,b)) < (p1+3*p2)
now, by replacing this line with
if (Form("Calo_Time[%d]-Calo_Time[%d]",a,b))> (p1-3*p2) && (Form("Calo_Time[%d]-Calo_Time[%d]",a,b)) < (p1+3*p2)
I don’t get the error (In the attachment the macro after the bug fixed)
calo.cpp (6.2 KB)
- Even if I don’t get the error, I don’t get the right results, because of the total events are 6119 and I get 6119 also by using the cut selection (I should get a lower number of events because of I reject the events out of the range )