IVM
July 2, 2019, 4:00pm
1
Hi everyone,
I’d like to add the Landau fit parameters in the stats box
TF1 *Fit_ph_2 = new TF1(“ph_2”,“landau”,-1,10);
I used that code to draw the landau fit, and
but it only shows the parameters of a Gaussian dist. fit that I applied before.
thank you.
couet
July 3, 2019, 8:27am
2
Can you post a small macro reproducing this issue ?
also see here how to post code in the forum.
IVM
July 3, 2019, 8:49am
3
Hi @couet
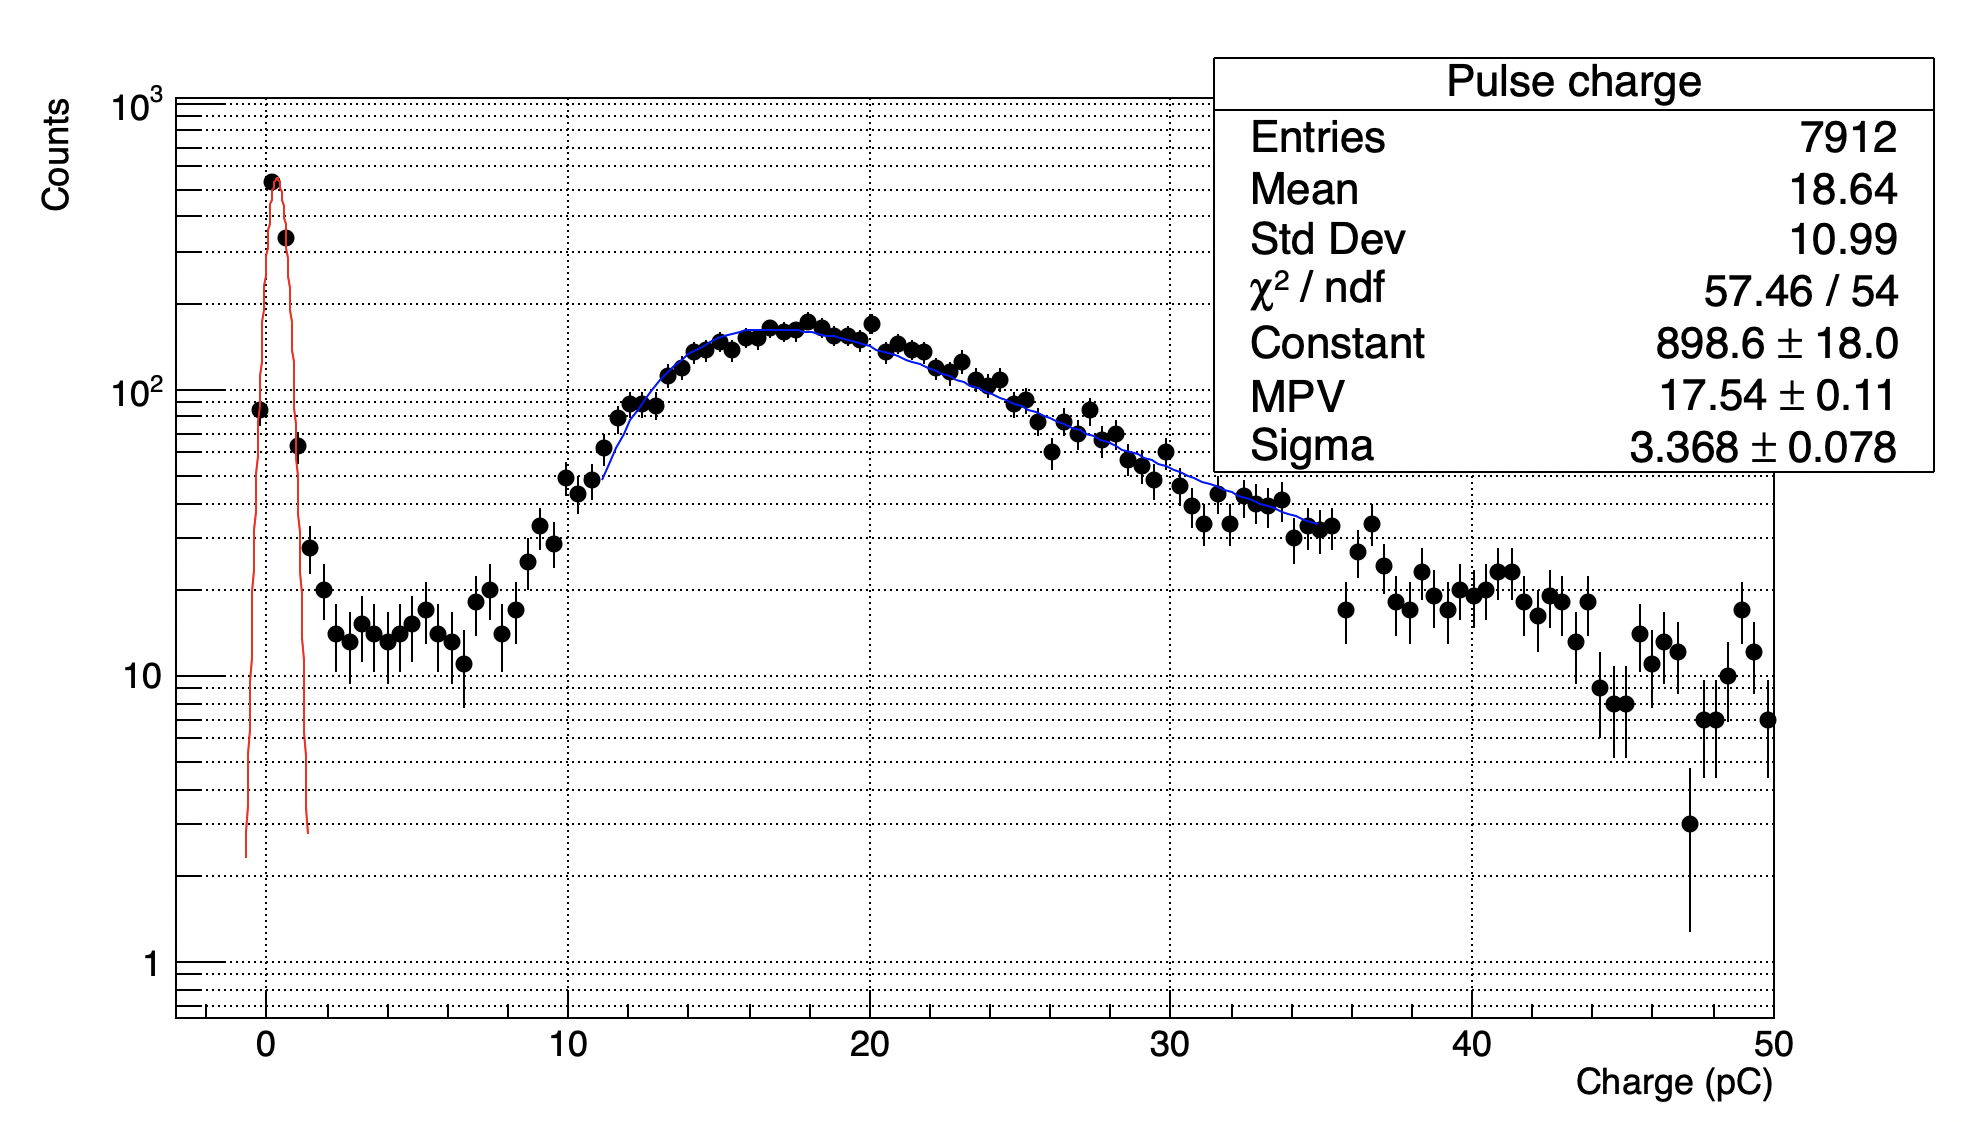
TH1 *h1 = new TH1F("Pulse charge","", 125, -10,160);
gPad-> SetLogy();
TF1 *Fit_Ped_gaus_1 = new TF1("Ped_gaus_1","gaus",Ped_gaus_1_min,Ped_gaus_1_max);
Fit_Ped_gaus_1->SetLineColor(kRed);
h1->Fit(Fit_Ped_gaus_1,"R+");
Fit_Ped_gaus_1->GetParameters(&par[0]);

TF1 *Fit_ph_2 = new TF1("ph_2","landau",landau_min,landau_max);
Fit_ph_2->SetLineColor(kRed);
h1->Fit(Fit_ph_2,"R+");
Fit_ph_2->GetParameters(&par[3]);

gStyle->SetOptFit(0111);
h1->Draw("ep*");
The problem is that I can’t find any example of how to put the Landau fit parameters in the stat box. With that code its not posible.
Thank you.
couet
July 3, 2019, 9:10am
4
It seems fine to me:
$ root
------------------------------------------------------------
| Welcome to ROOT 6.19/01 https://root.cern |
| (c) 1995-2019, The ROOT Team |
| Built for macosx64 on Jun 28 2019, 07:44:41 |
| From heads/master@v6-19-01-295-g30065525ce |
| Try '.help', '.demo', '.license', '.credits', '.quit'/'.q' |
------------------------------------------------------------
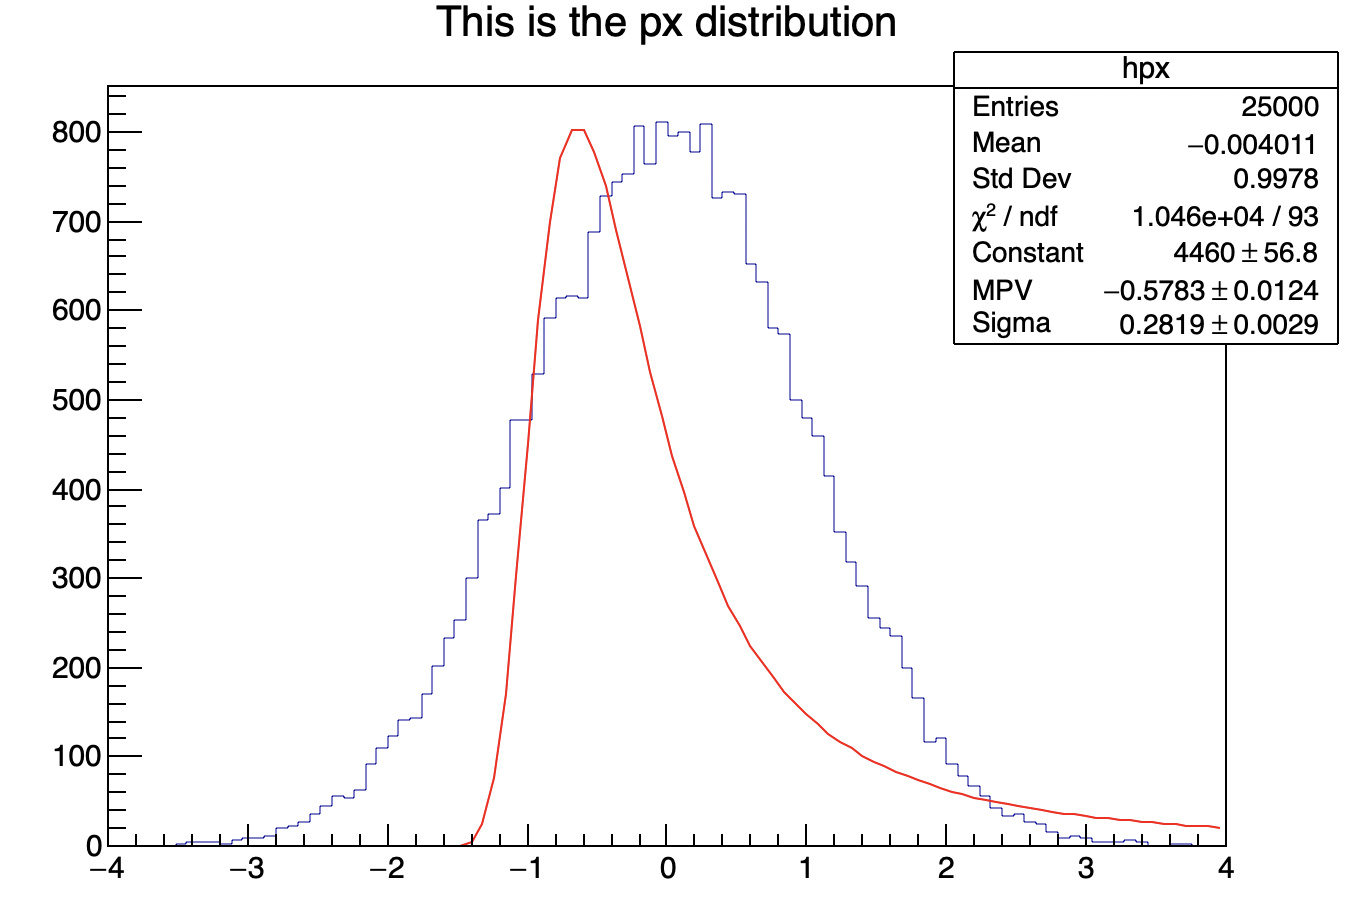
root [0] hpx->Fit("landau")
Info in <TCanvas::MakeDefCanvas>: created default TCanvas with name c1
FCN=10457.6 FROM MIGRAD STATUS=CONVERGED 119 CALLS 120 TOTAL
EDM=6.32046e-11 STRATEGY= 1 ERROR MATRIX UNCERTAINTY 1.6 per cent
EXT PARAMETER STEP FIRST
NO. NAME VALUE ERROR SIZE DERIVATIVE
1 Constant 4.46028e+03 5.67908e+01 1.11302e-01 3.82344e-07
2 MPV -5.78311e-01 1.23871e-02 1.91197e-05 -5.33289e-04
3 Sigma 2.81868e-01 2.94427e-03 -2.63349e-06 8.23576e-03
(TFitResultPtr) <nullptr TFitResult>
root [1] gStyle->SetOptFit(111);
IVM
July 3, 2019, 9:17am
5
yes. but if you fit with a Gaussian and then in the same histogram you fit with a Landau distribution you won’t get the parameters of the landau distr. in the stat box, you will only get the gaussian parameters in the stat box
couet
July 3, 2019, 9:23am
6
Not in may case. If I do:
root [0] hpx->Fit("gaus")
Info in <TCanvas::MakeDefCanvas>:  created default TCanvas with name c1
 FCN=63.6385 FROM MIGRAD    STATUS=CONVERGED      54 CALLS          55 TOTAL
                     EDM=6.235e-10    STRATEGY= 1      ERROR MATRIX ACCURATE
  EXT PARAMETER                                   STEP         FIRST
  NO.   NAME      VALUE            ERROR          SIZE      DERIVATIVE
   1  Constant     8.00108e+02   6.20101e+00   1.98916e-02  -6.18780e-06
   2  Mean        -3.86196e-03   6.30762e-03   2.47615e-05   1.13881e-03
   3  Sigma        9.94740e-01   4.45485e-03   4.77918e-06  -2.46080e-02
(TFitResultPtr) <nullptr TFitResult>
root [1] hpx->Fit("landau")
 FCN=10457.6 FROM MIGRAD    STATUS=CONVERGED     119 CALLS         120 TOTAL
                     EDM=6.32046e-11    STRATEGY= 1  ERROR MATRIX UNCERTAINTY   1.6 per cent
  EXT PARAMETER                                   STEP         FIRST
  NO.   NAME      VALUE            ERROR          SIZE      DERIVATIVE
   1  Constant     4.46028e+03   5.67908e+01   1.11302e-01   3.82344e-07
   2  MPV         -5.78311e-01   1.23871e-02   1.91197e-05  -5.33289e-04
   3  Sigma        2.81868e-01   2.94427e-03  -2.63349e-06   8.23576e-03
(TFitResultPtr) <nullptr TFitResult>
root [2] gStyle->SetOptFit(111);
I get the same plot as before. May be provide some macro we can run to test.
IVM
July 3, 2019, 9:33am
7
AREA.txt (238.8 KB) Hist.C (2.0 KB)
those are the macro and the data.
IVM
July 3, 2019, 12:18pm
9
what about the parameters of the gaussian ? I need both, the parameters of the gaussian and parameters of the landau in the stat box .
couet
July 3, 2019, 1:31pm
10
ah ok … let me see… That was not clear you needed both
couet
July 3, 2019, 1:41pm
11
I think it was already answered here:
Hello,
I would like to fit a graph using multiple functions each for a given x-axis range, and to display the fit parameters on the canvas.
TF1 *fit_1 = new TF1(“fit_1”,“pol6”,1.e-9,10.);
fit_1->SetLineColor(kBlue);
TF1 *fit_2 = new TF1(“fit_2”,“pol3”,10.,1.e4);
fit_2->SetLineColor(kRed);
gr_neutron->Fit(fit_neutron_1,“R”);
gr_neutron->Fit(fit_neutron_2,“R+”);
I am obviously aware of using Options->Show Fit Parameters or the equivalent command line gStyle->SetOptFit(). But both result in…
system
July 17, 2019, 1:52pm
12
This topic was automatically closed 14 days after the last reply. New replies are no longer allowed.


 that’s the problem.