Hello,
(I suspect I have the same problem stated here, but I’m not sure, and anyway is an old post for an old version. I’m using 6.08/06, but I can upgrade if it solves the problem).
If I do (I try in interactive mode for simplicity, but inside scripts it doesn’t seem different):
g = new TGraph()
g->SetPoint(0,1,2)
g->Draw("AP")
g->SetPoint(1,6,9)
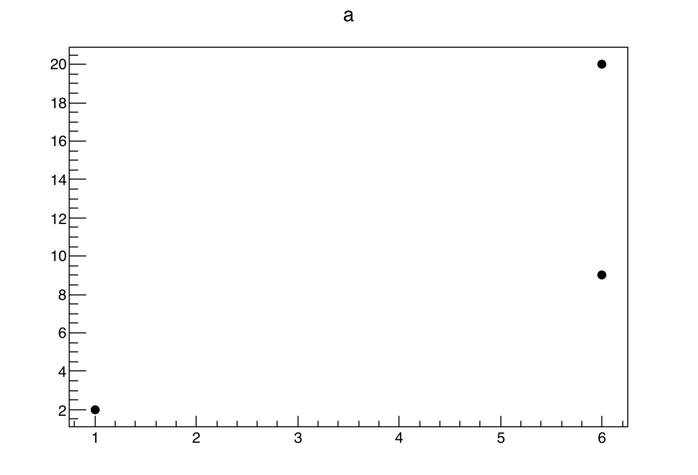
When the canvas is updated the axis are adjusted considering both points, and I can see the Graph correctly.
Now, I would like to do the same with a MultiGraph (that is nice exactly because calculates the axes for me): I first plot some graphs with some points (in the example here, it will be only one) in a TMultiGraph; then I look at the result, and basing on that I decide how to further populate the graphs (and so on): but the axes are not updated!
a = new TMultiGraph("a","a")
g = new TGraph()
g->SetPoint(0,1,2)
a->Add(g)
a->Draw("AP")
g->SetPoint(1,6,9)
If the new point happened to be inside the old axis range, it is shown.
Is there nowadays a correct way to do what I would like to? In the linked question a workaround is presented by the asker:
using copies of all TGraph objects. Then when it is necessary to add a new graph I delete TMultiGraph object, create new one and add all graphs to it in one place
but certainly there will be a better way?
Thank you!
Concetto