How to read the parameters of the fit-model in Rooworkspace

exe2.C (2.2 KB)
hig.txt (330.5 KB)


Hi everyone,
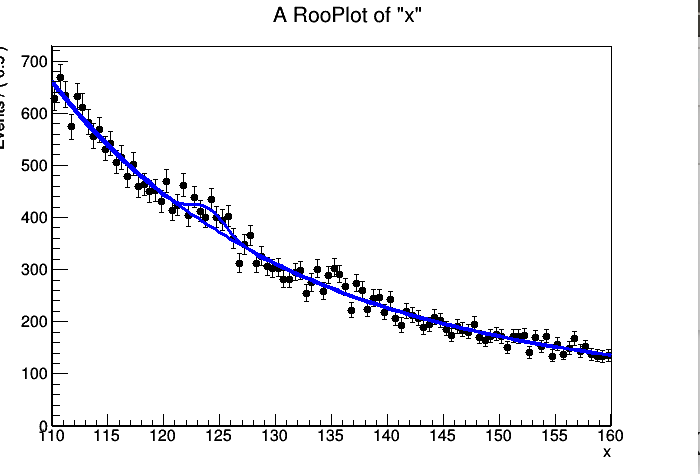
**1.**As the picture(sig.png) shows, there is a signal above the background.
Now I want to draw the peak(bkg) separately which are supposed to be below the blue line.
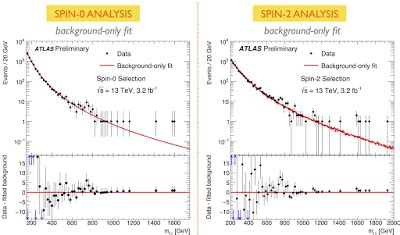
The line I want to get is that it is very close to zero outside[120,125]and that it has a bkg “peak” in [120,125]. That is to say I want to extract the peak and draw it.
2 And I also want to get a picture like sample.jpeg. But still I don’t know how to extract the"bkg" data.
sample

I am not very good at English. Hopefully you can get me. Thanks very much for your patience!

xin

@StephanH our new RooFit expert is on vacation this week. I hope he can help out when he’s back!

Dear Axel ,
Thanks for your information.

xin

Hello @123,

try this for plotting:

model->plotOn(plot, LineColor(kRed));
model->plotOn(plot, Components("sig_pdf"), LineColor(kRed), Range(120, 130));
model->plotOn(plot, Components("bkg_pdf"), LineColor(kBlue));

Is this what you had in mind?

More about plotting components you can find here:
https://root.cern.ch/root/html/tutorials/roofit/rf205_compplot.C.html

Hello Hageboeck,
Yes , this is exactly what I want. Thanks for your kindly help!