I made boxes to represent hits in an event viewer (using TEveBoxSet). The colour of each box represents a value (energy deposit for instance). I defined a gradient ColorPalette according to the code below but I would like to display an axis with the full range somehow in the viewer (something like a TPaletteAxis in a 2D histogram) so that we know e.g if dark blue is the highest or the lowest value.
See picture attached.
Look at tutorials/eve boxset.C and overlay_palette.C.
The idea is that you tell Digit/Quad/BoxSet about the palette and set DigitValue for each box. Then you get controls for the min/max values and choice what to do with overflow/underflow (and even plot histos from the second tab).
Hi again,
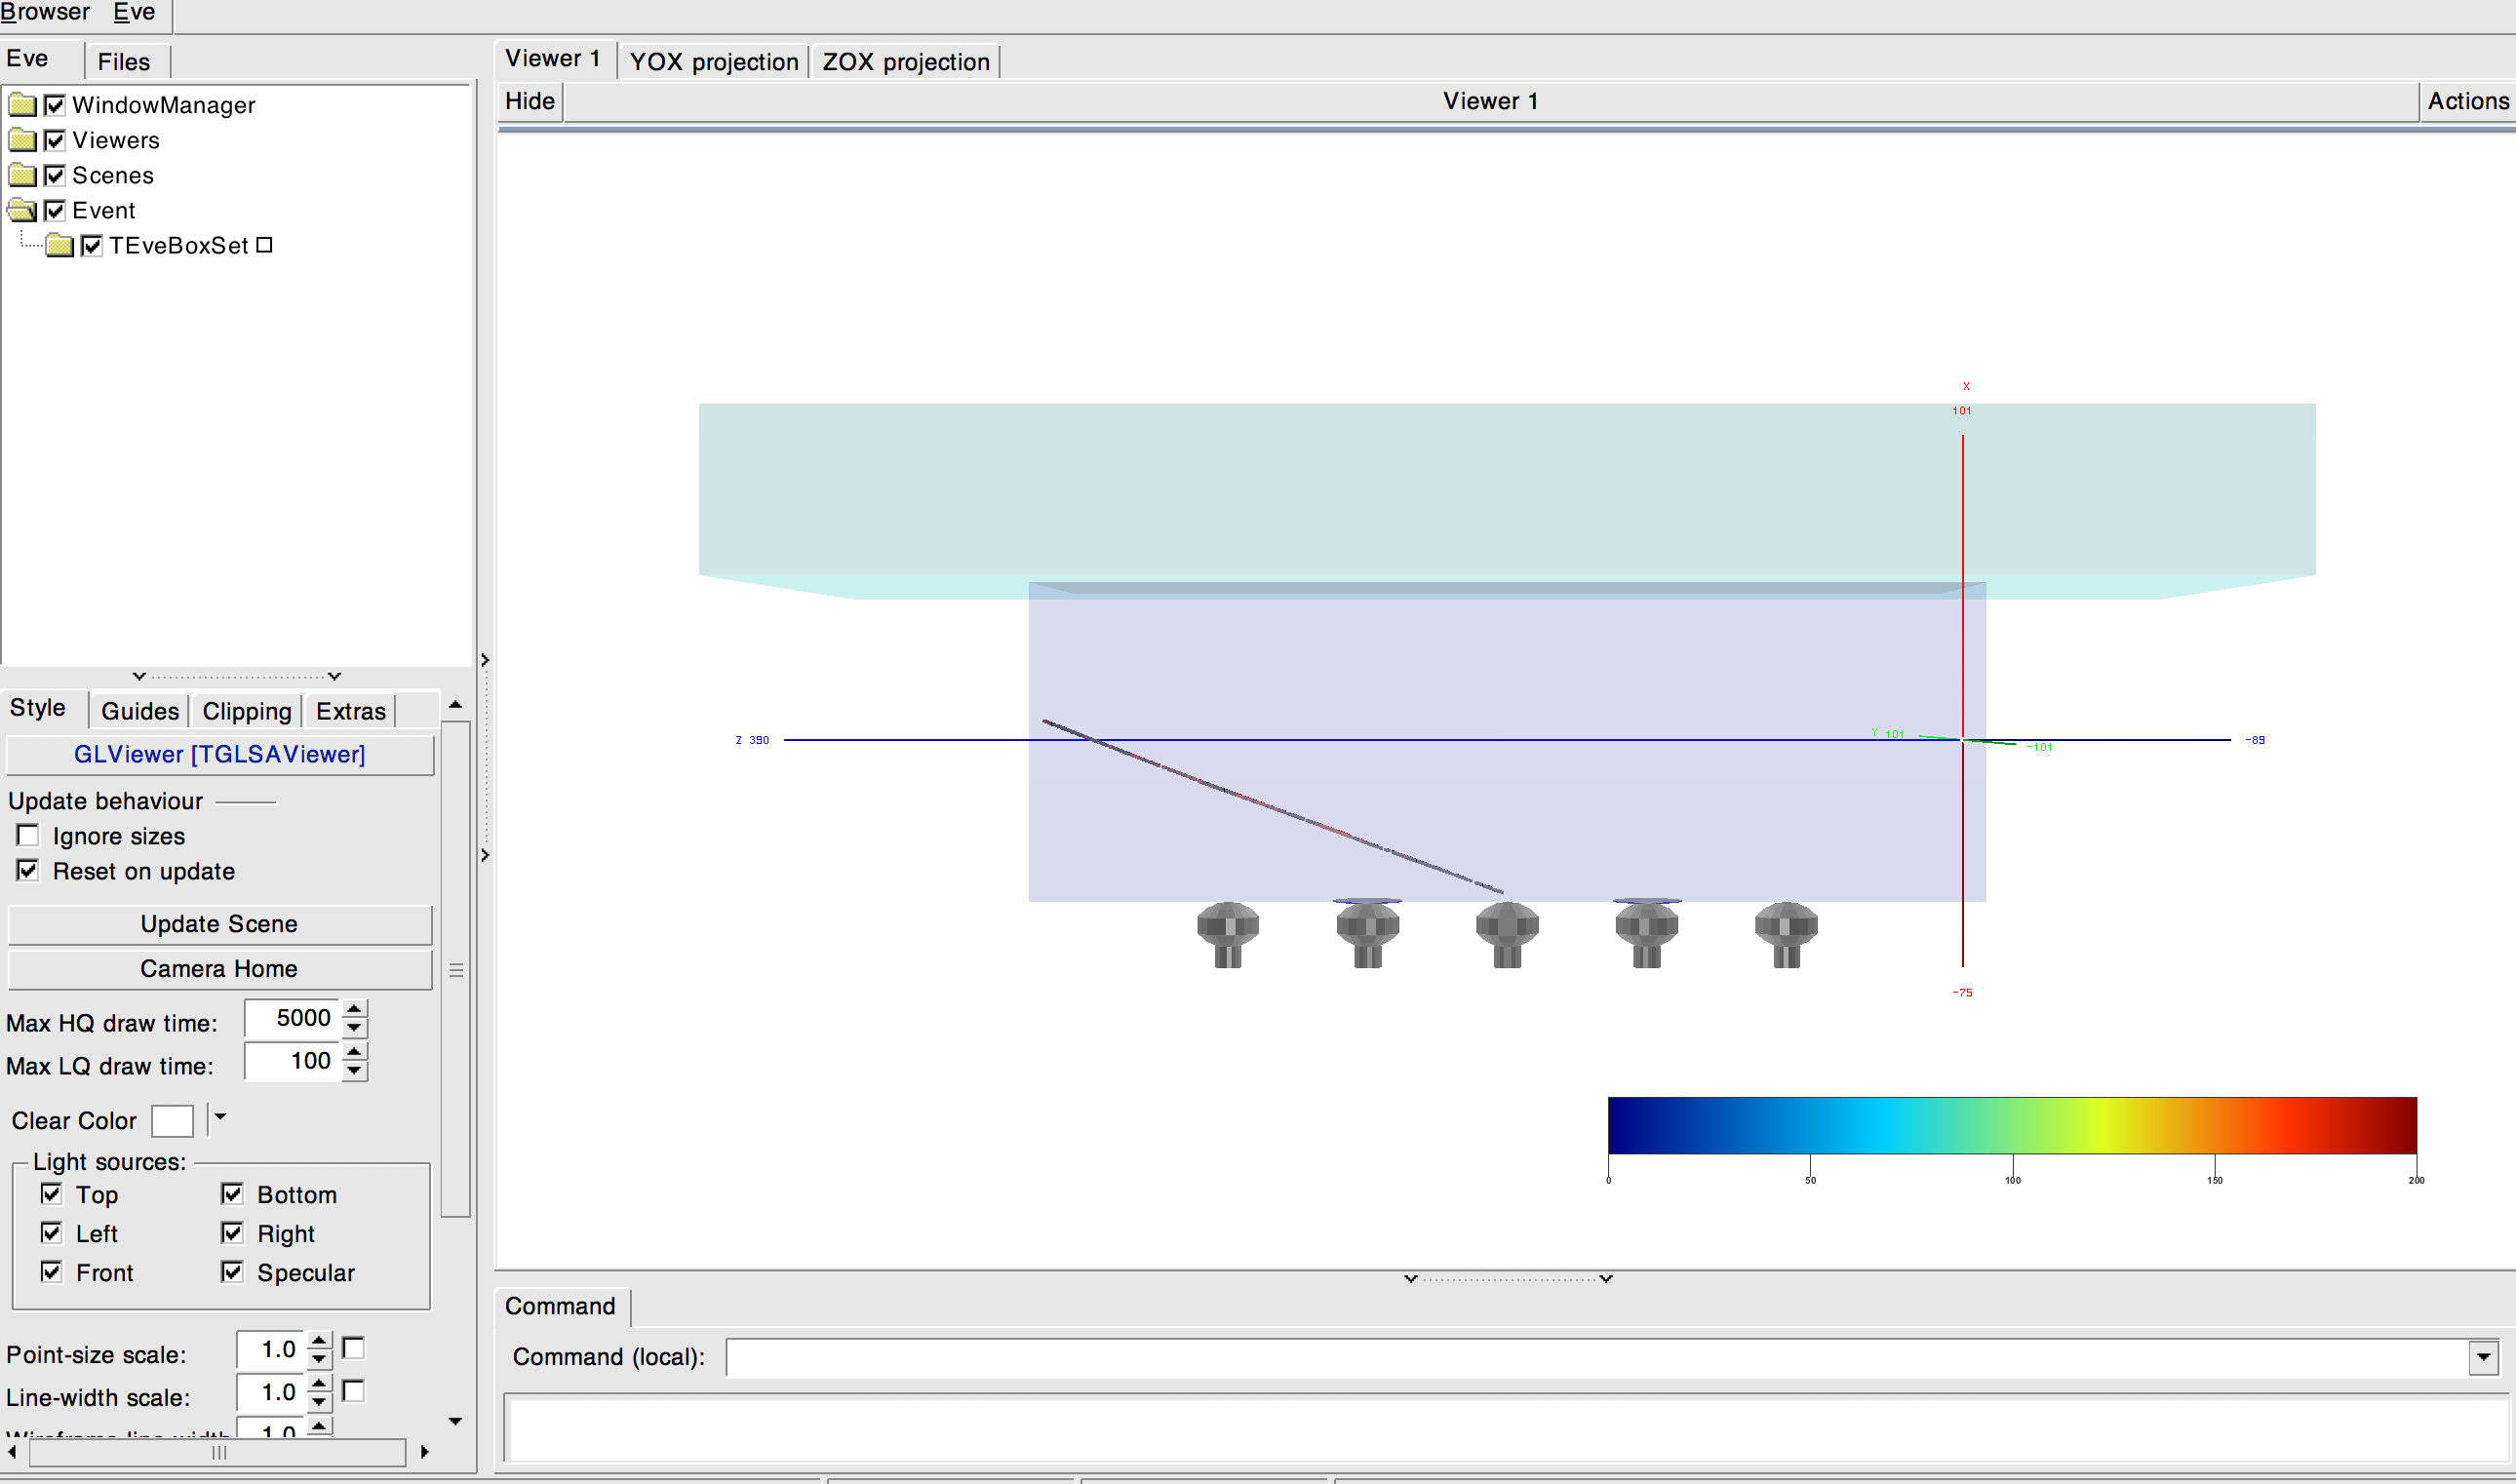
so all ok to set the colours of the TEVEBoxSet according to a TEveRGBAPalette (colours still not great need to work on this), however the overlay palette is nowhere to be found in the viewer. I tried playing with the position of the overlay palette at declaration tried to update the GLViewere in many different ways. See part of the code below and a snapshot.
Thanks,
pal=TEveRGBAPalette(0,100)
po=TEveRGBAPaletteOverlay(pal, 0, 0, 40, 500); #I tried playing with different positions height and width

#... not shown load gdml geometry ad it to TEVEmamanger

#... not shown loop on event and create TEVEBoxset, set the digit color and add it to TEve...

#now try to draw the palette in the viewer
f3DView=gEve.GetDefaultViewer()
f3DView.GetGLViewer().SetGuideState(ROOT.TGLUtil.kAxesOrigin, ROOT.kTRUE, ROOT.kFALSE, GuideRef)
f3DView.GetGLViewer().SetCurrentCamera(ROOT.TGLViewer.kCameraPerspYOZ)
f3DView.GetGLViewer().AddOverlayElement(po)
f3DView.GetGLViewer().UpdateScene()
f3DView.GetGLViewer().DoDraw()

gEve.GetViewers().SwitchColorSet()
gEve.FullRedraw3D(ROOT.kTRUE)
#Palette is not shown see drawing